
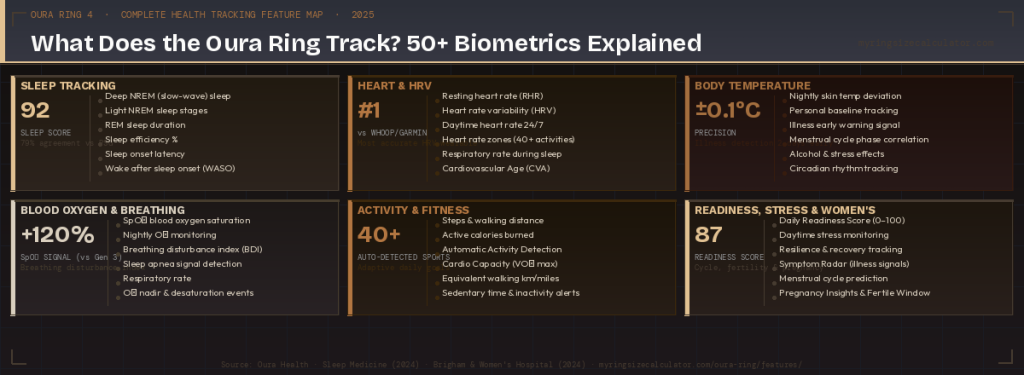
The Oura Ring tracks over 50 biometrics continuously, 24 hours a day, while you sleep, move, work, and rest — packaging the equivalent of a hospital monitoring suite into a ring you wear on one finger. But what exactly does it measure, how does it measure it, and how accurate is the data? This guide answers all of those questions in full.
Whether you want to understand the Sleep Score, Readiness Score, Heart Rate Variability, blood oxygen monitoring, Cardiovascular Age, or women’s health features — this is the definitive science-backed reference for every Oura Ring health tracking feature in 2026.
| ⚡ Quick Answer — What Does the Oura Ring Track? The Oura Ring tracks 50+ biometrics across six categories: 1. Sleep (deep, REM, light stages, efficiency, latency), 2. Heart Health (resting HR, HRV, cardiovascular age, VO₂ max, respiratory rate), 3. Body Temperature (nightly deviation, illness signals, cycle tracking), 4. Blood Oxygen (SpO₂, breathing disturbance index), 5. Activity & Fitness (40+ auto-detected sports, steps, calories, cardio capacity), and 6. Readiness & Stress (Daily Readiness Score, daytime stress, resilience, Symptom Radar, women’s health features). |
1. The Oura Ring Sensor System: How It Collects Data
All of Oura’s health tracking originates from three hardware sensor types working in continuous concert. Understanding what these sensors do explains why the finger is a superior biometric measurement site to the wrist, and why the Gen 4’s Smart Sensing platform represents such a significant advance over earlier designs.
The Three Core Sensors
| Sensor | What It Measures | How It Works |
| 18-path PPG subsystem (Gen 4) | Heart rate, HRV, SpO₂, respiratory rate | Red, infrared & green LEDs emit light; photodetectors measure variation in light absorption caused by arterial blood pulsing — adapted dynamically across 18 pathways |
| NTC Temperature sensor | Skin surface temperature trends | Negative temperature coefficient thermistor measures thermal variation to ±0.1°C precision against your personal baseline |
| 3D Accelerometer | Movement, steps, activity type, sleep position | Three-axis motion sensor tracks acceleration at high frequency — used for activity detection, sleep staging, and heart rate signal quality control |
Why the Finger Beats the Wrist
The finger as a biometric measurement site is superior to the wrist for optical heart rate monitoring because the digital arteries running along the palm side of the finger are positioned significantly closer to the skin surface than the radial artery at the wrist. The signal-to-noise ratio for PPG measurements at the finger is higher, less prone to motion artefact during normal movement, and not affected by the bony structures and tendons that complicate wrist-based measurements.
This anatomical advantage is why the Oura Ring consistently outperforms wrist-worn wearables in independent accuracy benchmarks — including studies from Brigham and Women’s Hospital and the Physiological Society — and why Oura’s data forms the basis of peer-reviewed research published in journals including Sleep Medicine, Sensors, npj Digital Medicine, and PLOS Digital Health.
2. Sleep Tracking: How Oura Measures Your Sleep
Sleep tracking is the feature that established Oura’s reputation and remains its most scientifically validated capability. Oura’s Sleep Staging Algorithm (OSSA 2.0) uses a combination of accelerometer data, heart rate, HRV, and temperature to classify each 30-second epoch of your sleep into one of four stages — Wake, Light NREM, Deep NREM, and REM — and has been independently validated against polysomnography (PSG), the gold-standard clinical measure of sleep, in multiple peer-reviewed studies.
What the Oura Ring Measures During Sleep
| Sleep Metric | What It Reveals | Clinical Significance |
| Total sleep time | How many hours you actually slept | Compared to ideal 7–9 hours for adults (per WHO/CDC guidelines) |
| Sleep efficiency | % of time in bed actually spent asleep | Below 85% is clinically considered poor sleep quality |
| Sleep onset latency | Minutes from lying down to falling asleep | Over 20–30 min may indicate insomnia or poor sleep hygiene |
| Wake after sleep onset (WASO) | Minutes awake after initial sleep onset | A key marker of sleep continuity and quality |
| Deep NREM (slow-wave) sleep | Physically restorative sleep stage | Critical for tissue repair, growth hormone release, immune function |
| REM sleep | Dream sleep — cognitively restorative | Essential for memory consolidation, emotional processing |
| Light NREM sleep | Transitional sleep stages N1 and N2 | Accounts for majority of sleep time; necessary for sleep architecture |
| Sleep regularity | Consistency of sleep timing night to night | Strong predictor of metabolic health and cardiovascular risk |
| Restfulness | Movement and disruptions during sleep | Low restfulness correlates with poor sleep quality even at adequate duration |
| Respiratory rate | Breathing rate during sleep | Elevated rate can indicate stress, illness, or sleep-disordered breathing |
Sleep Staging Algorithm Accuracy: The Science
A landmark validation study published in Sleep Medicine in January 2024 evaluated the Oura Ring Gen 3 with OSSA 2.0 against polysomnography across 96 participants and 421,045 thirty-second epochs — one of the largest validation datasets for any consumer sleep wearable. Key findings:
- 94.4–94.5% sensitivity: The ring correctly identified sleep epochs as sleep with exceptional accuracy
- 91.7–91.8% overall accuracy: Agreement between Oura Ring and PSG for sleep/wake classification
- 90.6% accuracy for REM sleep detection: The highest of any consumer wearable tested against PSG at that time
- 75.5% accuracy for Light sleep: The most challenging stage to distinguish — consistent with inter-rater reliability between human PSG scorers
- No significant difference vs PSG: For total sleep time, sleep onset latency, wake after sleep onset, light sleep duration, and deep sleep duration
A separate study conducted by researchers at Brigham and Women’s Hospital (published in Sensors and presented at Sleep Europe 2024) found that Oura Ring was 5% more accurate than Apple Watch and 10% more accurate than Fitbit in four-stage sleep classification. The Brigham and Women’s study achieved 79% agreement with PSG — close to the inter-rater reliability of human sleep technicians scoring the same PSG data (83%).
A 2026 systematic review and meta-analysis published in OTO Open by the American Academy of Otolaryngology — covering 6 studies and 388 patients — further confirmed the Oura Ring’s validity across multiple sleep parameters. The full meta-analysis is available at: PMC / OTO Open (2026).
Sleep Bedtime Guidance & Smart Alarm
Beyond passive tracking, the Oura app provides personalised bedtime recommendations based on your chronotype (natural biological clock tendency) and historical sleep patterns. The app identifies your optimal sleep window — the times when your body is physiologically prepared for sleep and recovery — and sends gentle reminders to begin winding down. The smart alarm feature wakes you during a lighter sleep phase within a specified window, avoiding abrupt interruption of deep sleep that leaves you feeling worse than if you had slept longer.
| ▶ YouTube Video Resource How the Oura Ring Tracks Sleep — Official Oura Explainer — Watch on YouTube Official Oura Health video explaining how the ring’s sensors measure sleep stages, HRV, and temperature during the night. Recommended for new users wanting to understand the science behind their sleep data. |
3. The Three Core Scores: Sleep Score, Readiness Score & Activity Score
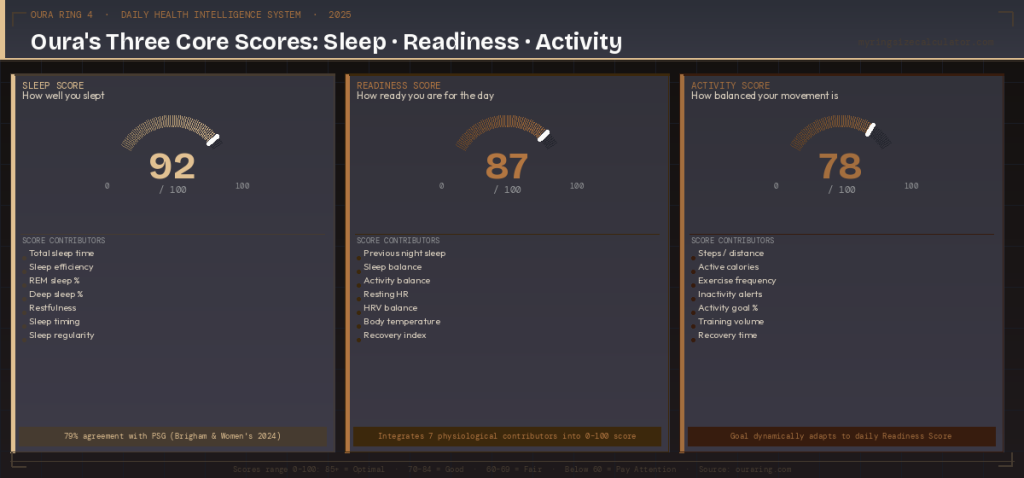
Oura synthesises its raw sensor data into three daily scores, each ranging from 0 to 100. These scores are the primary interface most users engage with daily — providing an at-a-glance summary of complex physiological data that would otherwise require clinical training to interpret.
The Sleep Score
The Sleep Score (0–100) answers the question: How well did you sleep last night? It draws from seven contributors weighted by Oura’s algorithm: Total sleep time, Sleep efficiency, Restfulness, REM sleep, Deep sleep, Sleep latency, and Sleep timing. A score above 85 receives a crown icon in the app. A score below 70 triggers Oura’s recovery guidance for the day.
The Readiness Score
The Readiness Score is Oura’s signature metric — a holistic picture of how recovered and prepared your body is for the demands of the coming day. It draws from seven contributors: Previous night’s sleep, Sleep balance (your recent sleep debt), Activity balance (whether you have been training too hard or not enough), Resting heart rate (deviation from your baseline), HRV balance (multi-day HRV trend), Body temperature (deviation from baseline), and Recovery index (how quickly your HR recovered overnight).
The Readiness Score is unique because it integrates longitudinal trends, not just last night’s data. An isolated poor sleep has less impact on Readiness than a week of accumulating sleep debt. This temporal intelligence is what makes the Readiness Score more clinically meaningful than simple overnight heart rate metrics. The full methodology is documented on the Oura Readiness Score page.
The Activity Score
The Activity Score answers the question: Am I balancing movement and rest appropriately? Rather than rewarding raw volume of exercise, it evaluates whether your activity level is appropriate for your current recovery state. On a low-Readiness day, Oura will lower your activity goal — the ring actively discourages overtraining when your body signals it needs rest. The Activity Score draws from: Steps/distance, Active calories burned, Exercise frequency, Inactivity alerts, Activity goal completion, Training volume, and Recovery time
Score Interpretation Guide
| Score Range | Status | What It Means |
| 85–100 (Crown) | Optimal | Your body is well-recovered. Tackle demanding physical or cognitive challenges. |
| 70–84 | Good | Your body is ready for normal activity. Moderate training is appropriate. |
| 60–69 | Fair | Your body is partially recovered. Lighter activity recommended. |
| Below 60 | Pay Attention | Your body is under strain. Prioritise sleep, rest, and light movement only. |
4. Heart Rate & HRV Tracking: Accuracy and What It Tells You
Heart rate and heart rate variability (HRV) are the physiological metrics at the heart of Oura’s health intelligence platform. The ring measures these 24 hours a day — during sleep using red and infrared LEDs, and during waking hours using green and infrared LEDs alternating in real time.
Resting Heart Rate (RHR)
Oura calculates your resting heart rate from continuous overnight heart rate measurements, selecting the lowest stable readings during periods of deep sleep. RHR is one of the most powerful indicators of cardiovascular fitness and recovery status — a lower RHR generally indicates better cardiovascular health, and a temporarily elevated RHR (above your personal baseline) is one of the earliest physiological signals of illness, overtraining, or elevated stress.
According to the American Heart Association, a normal adult resting heart rate is 60–100 bpm, while well-trained athletes can have RHR as low as 40 bpm. Oura tracks your personal baseline and flags deviations — not absolute values — making the insight personalised rather than population-generic.
Heart Rate Variability (HRV)
HRV measures the variation in time between successive heartbeats. Counterintuitively, more variation is a sign of health — a healthy nervous system fluidly adjusts heart rhythm in response to moment-to-moment physiological needs. Low HRV indicates the nervous system is under load (from stress, illness, or insufficient recovery), while high HRV indicates parasympathetic dominance — a state of recovery, calm, and readiness.
Oura measures HRV as RMSSD (Root Mean Square of Successive Differences) — the standard measure in clinical and research settings. HRV is measured in 5-minute windows throughout the night and averaged for the complete sleep period. A 2026 independent study published in Physiological Reports (PMC) compared the Oura Ring Gen 3 and Gen 4 against an ECG reference across 536 nights and 13 participants, finding that Oura Ring consistently showed the strongest HRV and RHR accuracy among all five consumer wearables tested — outperforming WHOOP 4.0, Garmin Fenix 6, and Polar Grit X Pro.
Cardiovascular Age (CVA)
Launched in 2024, Cardiovascular Age is one of Oura’s most clinically significant features. It uses the PPG signal’s photoplethysmographic waveform shape to estimate pulse wave velocity (PWV) — a validated measure of arterial stiffness and vascular ageing. CVA tells you whether your cardiovascular system appears biologically younger, older, or equivalent to your chronological age.
After 14 days of wear, Oura displays your CVA relative to your chronological age — indicating whether your vascular system is trending below, above, or within 5 years of your actual age. The feature was developed in partnership with board-certified cardiologists and scientists at the Kuopio Research Institute of Exercise Medicine (KULTU) and UCLA. CVA responds meaningfully to lifestyle improvements — regular aerobic exercise, better sleep, and stress reduction have been shown to reduce arterial stiffness and potentially improve CVA over time.
Cardio Capacity (VO₂ Max)
VO₂ max — the maximum rate at which your body can consume oxygen during intense exercise — is one of the strongest predictors of long-term cardiovascular health and all-cause mortality. A landmark study in JAMA found that low cardiorespiratory fitness (measured by VO₂ max) is a more powerful risk factor for mortality than smoking, hypertension, or diabetes.
Oura’s Cardio Capacity feature provides a VO₂ max estimate based on a six-minute walking test conducted via the Oura app. The initial estimate uses anthropometric data (age, sex, height, weight); the walking test refines this significantly. The feature was developed in collaboration with KULTU and UCLA, and tracks changes over time to show whether your cardiorespiratory fitness is improving, stable, or declining.
5. Body Temperature Tracking: The Quiet Superpower
Body temperature monitoring is one of Oura’s most underappreciated features — yet it is arguably one of the most clinically revealing. The Oura Ring measures skin surface temperature at the finger every night using its NTC thermistor, calculating the deviation from your personal seven-night baseline rather than comparing your reading to a population average. This personalised approach makes even small deviations — as little as 0.2–0.3°C — meaningful signals.
What Temperature Deviation Reveals
| Temperature Signal | What It Typically Indicates | Timing |
| Elevated deviation (+0.5°C or more) | Illness onset — immune system activation | Often detectable 1–2 days before subjective symptoms |
| Elevated deviation | Alcohol consumption night before | Appears same night; alcohol elevates body temperature during metabolism |
| Elevated deviation | Overtraining or physiological stress | Accumulates over days of insufficient recovery |
| Cyclical elevation patterns | Ovulation and luteal phase (women) | Rise of ~0.3–0.5°C after ovulation; used for cycle tracking |
| Drop below baseline | Post-ovulation window closing; late luteal phase | Combined with trend data enables menstrual prediction |
| Gradual sustained elevation | Pregnancy (early weeks) | Basal body temperature remains elevated through first trimester |
The UCSF TemPredict Study: 2-Day Early Illness Warning
The most dramatic demonstration of Oura’s temperature monitoring capability came from the TemPredict Study at the University of California San Francisco. Conducted with 65 COVID-19 positive participants during the early pandemic period, the study found that Oura’s temperature data alone could detect illness onset an average of two days before participants reported subjective symptoms — and in some cases up to three days before. This finding has since been independently replicated in several follow-on studies and remains one of the most cited validation results in the consumer wearable literature.
The TemPredict research established temperature deviation monitoring as a genuine early warning system — not just for COVID-19 but for any febrile illness involving immune system activation. Many Oura users have reported noticing temperature elevation alerts in the Oura app the night before falling sick with flu, colds, or other infections. For more on how Oura Ring detects illness, see: Benefits of Oura Ring 4.
6. Blood Oxygen (SpO₂) Tracking: Monitoring While You Sleep
The Oura Ring measures blood oxygen saturation (SpO₂) while you sleep using red and infrared LEDs. Oxygenated haemoglobin absorbs more infrared light and less red light than deoxygenated haemoglobin — by measuring the ratio of red to infrared absorption, the ring calculates your blood oxygen percentage throughout the night.
In the Gen 4, Smart Sensing’s 18-path adaptive PPG subsystem delivers a +120% improvement in SpO₂ signal quality versus the Gen 3 — translating to 30% more accurate average overnight SpO₂ readings. This is particularly significant for detecting breathing disturbances.
SpO₂ and Sleep-Disordered Breathing
SpO₂ monitoring is the key to Oura’s ability to flag potential sleep-disordered breathing — the category of conditions that includes obstructive and central sleep apnea, affecting an estimated 1 billion people globally according to the World Health Organization. During an apnea event, breathing pauses cause oxygen levels to drop — a pattern the ring’s Breathing Disturbance Index (BDI) is designed to detect.
| ⚠️ Important Medical Disclaimer Oura Ring is not a medical device and cannot diagnose sleep apnea or any other medical condition. If the Oura app flags frequent breathing disturbances or low SpO₂ readings, this is a signal to discuss with your doctor — not a diagnosis. A proper sleep apnea diagnosis requires a sleep study (polysomnography or home sleep test) ordered and interpreted by a qualified healthcare provider. For detailed guidance:Can the Oura Ring Detect Sleep Apnea? |
Normal SpO₂ Ranges
A healthy adult’s SpO₂ during sleep typically ranges from 95–100%. Values consistently below 90% during sleep are considered clinically significant and warrant medical evaluation. Oura displays your average nightly SpO₂ and flags any nights with significant desaturation events. For context on what SpO₂ values mean: Does the Oura Ring Measure Blood Pressure?.
7. Activity Tracking & Automatic Activity Detection

Oura’s approach to activity tracking is fundamentally different from step-counting wearables. Rather than setting a universal goal (the 10,000 steps benchmark has no scientific basis — see Wikipedia: 10,000 steps), Oura creates a personalized activity goal each day based on your Readiness Score. If your body is well-recovered, the goal is higher. If your body is under strain, the goal is lower — actively discouraging the overtraining that undermines long-term health.
Automatic Activity Detection (AAD)
The Gen 4’s Automatic Activity Detection identifies over 40 sports and activities without manual input — from running, cycling, and swimming to yoga, hiking, and weight training. AAD delivers heart rate data and heart rate zone breakdowns for each detected session, giving you training intensity context without requiring you to press start on an app.
| Activity Category | Examples Detected |
| Cardio & running | Running, walking, cycling, swimming, rowing, hiking |
| Team & court sports | Basketball, football, tennis, badminton, volleyball |
| Mind-body | Yoga, pilates, meditation, stretching |
| Strength & gym | Weight training, CrossFit, HIIT, stair climbing |
| Everyday movement | Dancing, gardening, housework, elliptical, skiing |
| Other tracked | Boxing, martial arts, skating, surfing, climbing, and more |
What Activity Tracking Covers
- Steps and walking distance: Continuous accelerometer-based step count with daily and weekly trends
- Active calories burned: Total energy expenditure minus basal metabolic rate — the calories burned through movement
- Heart rate zones: During detected activities, Oura classifies effort into five HR zones to evaluate training intensity
- Equivalent walking km: A universal measurement unit that translates all physical activities (including non-step-based movement) into an equivalent walking distance
- Inactivity alerts: Notifications when you have been stationary for extended periods during the day
- Training frequency: Trend tracking of how consistently you are exercising week to week
8. Stress & Resilience Features
Oura added dedicated stress monitoring in 2024 — one of the most significant software capability additions since the Gen 3’s hardware launch. The platform now measures both daytime stress and long-term resilience as distinct but interconnected dimensions of your stress response physiology.
Daytime Stress Monitoring
The Daytime Stress feature uses continuous physiological data — particularly HRV, heart rate, and temperature — to assess your nervous system’s stress load throughout the day. The app displays a stress chart showing fluctuations from morning to evening, distinguishing between physiological stress (your body’s measurable response to demands) and recovery states.
The key insight is that some stress is healthy — exercise, cognitive challenge, and social engagement all create productive stress that builds capacity over time. The stress feature helps you identify when stress is accumulating beyond productive levels, when recovery is insufficient, and what activities (exercise, rest, meditation, social time) appear to reduce your stress levels based on your personalised data and any activity tags you add in the app.
Resilience Tracking
The Resilience feature takes a longer-term view of your stress response — measuring your ability to recover from stress loads over time. Oura assesses resilience by evaluating the ratio between the stress demands placed on your body and the recovery resources available. Users who regularly see high stress followed by adequate recovery are building resilience; users with chronic stress and insufficient recovery are eroding it.
Resilience is displayed in the My Health tab of the app as a longer-term trend — a sustained score rather than a daily metric — reflecting the fact that resilience is built or depleted over weeks and months, not overnight.
Symptom Radar
The Symptom Radar feature integrates multiple physiological signals — elevated temperature, elevated resting HR, depressed HRV, disrupted sleep architecture — to identify patterns consistent with oncoming illness. Rather than requiring a single definitive signal, Symptom Radar looks for the constellation of physiological changes that collectively suggest your immune system is under activation. Users often see Symptom Radar flags 24–48 hours before subjective symptoms appear.
9. Women’s Health: Cycle Insights, Fertility & Pregnancy
Oura’s women’s health features represent one of the most meaningful expansions of consumer health technology in recent years. By leveraging continuous temperature data that most wearables simply don’t collect, Oura provides physiologically grounded insights into the menstrual cycle, fertility window, and pregnancy that are unavailable from any other consumer device at this accuracy level.
Cycle Insights & Menstrual Tracking
The Cycle Insights feature uses temperature deviation patterns to track where you are in your menstrual cycle. After ovulation, progesterone causes a sustained rise in basal body temperature (BBT) of approximately 0.3–0.5°C above the follicular phase baseline. Oura detects this temperature shift and uses it to identify the luteal phase, predict the next menstruation, and build a model of your cycle length and regularity over time.
Unlike period-tracking apps that rely on self-reported data and population averages, Oura’s cycle insights are grounded in your actual physiology — measured nightly. This makes the predictions meaningfully more accurate for women with irregular cycles or those who do not menstruate at textbook 28-day intervals.
Fertile Window Detection
The Fertile Window feature helps identify the most likely window for conception — typically the 5 days before ovulation and the day of ovulation itself. Oura uses temperature trends (alongside optional manually logged symptoms) to estimate fertile window timing. The feature is intended as an educational health awareness tool and is not cleared by the FDA or any regulatory body as a contraceptive method or fertility treatment.
Natural Cycles Integration
Oura has an official integration with Natural Cycles — the world’s first FDA-cleared digital contraceptive app. When integrated, Oura automatically syncs nightly temperature data to the Natural Cycles algorithm, eliminating the need for manual BBT measurement with a separate thermometer. This integration represents the closest any consumer health ring has come to an approved contraceptive use case, though the clearance applies to the Natural Cycles algorithm, not the Oura Ring itself.
Pregnancy Insights
The Pregnancy Insights feature provides gestational-week-by-week context about physiological changes expected during pregnancy, correlating Oura’s continuous data against typical pregnancy physiology. Oura has also conducted a large-scale research collaboration retrospectively analysing 10,000 pregnancies using Oura Ring data to advance understanding of pregnancy-related conditions. The full scope of this research is published on the Oura Science & Research page.
10. Metabolic Health: Glucose, Meals & Dexcom Integration
Oura’s most recent expansion into metabolic health represents its most ambitious evolution beyond sleep and cardiovascular tracking. In 2025–2026, Oura launched a suite of features connecting the ring’s physiological data to glucose levels and dietary intake — creating a feedback loop between what you eat and how your body responds.
Glucose Tracking via Dexcom Stelo
Oura has partnered with Dexcom — the world’s leading continuous glucose monitoring (CGM) company — to integrate Stelo by Dexcom glucose data directly into the Oura app. Dexcom Stelo is an over-the-counter CGM (no prescription required in the US) that continuously monitors interstitial glucose levels every 15 minutes. When paired with Oura, you can see how your meals, sleep, exercise, and stress levels correlate with your glucose response — a genuinely novel health intelligence layer unavailable from any single-sensor device.
Meals Feature
The Meals feature allows you to log what you eat and see how your dietary choices correlate with your physiological data — including sleep quality that night, the next day’s HRV, body temperature, and (if using Dexcom) glucose response. This is the beginning of Oura’s progression toward metabolic phenotyping — understanding how your unique physiology responds to specific foods, not just what population averages suggest.
11. Oura App Features: Advisor, Oura Labs & Third-Party Integrations
Oura Advisor (AI-Powered Health Coach)
The Oura Advisor is an AI assistant built into the Oura app that contextualises your biometric data and provides personalised recommendations. Unlike generic health advice, Oura Advisor draws from your actual physiological history — your sleep trends, stress patterns, temperature data, HRV baseline — to answer questions like “Why is my Readiness Score low today?” or “How can I improve my HRV?” with answers rooted in your personal data rather than population-level generalizations.
Oura Labs
Oura Labs is the company’s early-access feature programme, where members can opt in to trial experimental health features before they become mainstream products. Labs has been the launchpad for features including Cardiovascular Age, Cardio Capacity, Resilience, Symptom Radar, and the Oura Advisor. Participating in Oura Labs also contributes anonymised physiological data to Oura’s research programmes.
Third-Party App Integrations
The Oura app integrates with over 40 third-party health and fitness apps, enabling your Oura data to flow into your broader health ecosystem:
| Integration Category | Apps/Platforms |
| General health platforms | Apple Health (iOS) · Google Health Connect (Android) |
| Fitness & training | Strava · Training Peaks · Final Surge · Wahoo · Garmin |
| Women’s health | Natural Cycles · Flo · Clue |
| Mental wellness | Calm · Headspace · Waking Up |
| Metabolic health | Dexcom Stelo (glucose) · Levels Health |
| Sleep | Eight Sleep · Sleep Cycle |
| Other | MyFitnessPal · Whoop (data export) · IFTTT automations |
The Oura App Interface
Following the October 2024 redesign, the Oura app is structured around three tabs: Today (the home dashboard with rotating spotlight cards, timeline, and activity tags), Vitals (expanding cards for all daily metrics including the new daytime stress chart), and My Health (long-term trends for Cardiovascular Age, Cardio Capacity, Resilience, and Sleep Trends). The app is available on iOS and Android in 12 languages.
12. Oura Ring Accuracy: What the Science Says
Oura Ring’s accuracy claims are not marketing — they are substantiated by a growing body of independent peer-reviewed research. As of 2026, 5.5 million Oura rings have been sold worldwide, and the device has been used as the data-collection platform in studies by Harvard Medical School, Brigham and Women’s Hospital, UCSF, the National University of Singapore, Stanford University, and dozens of other institutions.
| Metric | Accuracy Finding | Source |
| Sleep/wake classification | 94.4–94.5% sensitivity | Sleep Medicine (2024) — 96 participants, 421,045 epochs |
| 4-stage sleep staging | 79% agreement with PSG | Sensors / Brigham & Women’s Hospital (2024) |
| vs Apple Watch (4-stage) | 5% more accurate than Apple Watch | Brigham & Women’s Hospital (2024) |
| vs Fitbit (4-stage) | 10% more accurate than Fitbit | Brigham & Women’s Hospital (2024) |
| HRV accuracy vs ECG | #1 among 5 wearables tested | Physiological Society / PMC (2025) — 536 nights |
| RHR accuracy vs ECG | #1 among 5 wearables tested (tied Gen 3 & 4) | Physiological Society / PMC (2025) |
| SpO₂ signal quality (Gen 4) | 120% better than Gen 3 | Oura Smart Sensing Study (60 participants, 2024) |
| SpO₂ accuracy (Gen 4) | 30% more accurate overnight than Gen 3 | Oura Smart Sensing Study (2024) |
| Illness detection (temp) | Average 2 days before symptoms | UCSF TemPredict Study (2020–2021) |
| Most accurate for sleep | #1 consumer sleep tracker tested | National University of Singapore (cited by Oura) |
These findings reflect the most comprehensive independent accuracy validation dataset for any consumer health wearable. For the full scientific evidence: Oura Ring Science & Research · PubMed: Sleep Medicine Validation Study · PMC: HRV/RHR Physiological Society Study.
13. Frequently Asked Questions
What does the Oura Ring track?
The Oura Ring tracks 50+ biometrics across six categories: sleep staging (deep, REM, light NREM, efficiency, latency), heart health (resting heart rate, HRV, cardiovascular age, VO₂ max, respiratory rate), body temperature (nightly deviation, illness detection), blood oxygen (SpO₂, breathing disturbance index), activity (40+ auto-detected sports, steps, calories, cardio capacity), and readiness & stress (Readiness Score, daytime stress, resilience, Symptom Radar, women’s health features).
Is the Oura Ring the most accurate sleep tracker?
The Oura Ring is consistently rated the most accurate consumer sleep tracker in independent studies. A Brigham and Women’s Hospital study published in Sensors (2024) found Oura Ring was 5% more accurate than Apple Watch and 10% more accurate than Fitbit in four-stage sleep classification versus polysomnography. A 2026 systematic review in OTO Open confirmed this validity across multiple sleep parameters. The National University of Singapore also independently identified Oura Ring as the most accurate consumer wearable for sleep tracking among devices studied.
How accurate is the Oura Ring’s HRV?
A 2026 independent study published in Physiological Reports (Physiological Society) compared Oura Ring Gen 3 and Gen 4 against ECG across 536 nights and found that both Oura models showed the strongest HRV accuracy among all five devices tested — outperforming WHOOP 4.0, Garmin Fenix 6, and Polar Grit X Pro. The researchers noted ‘nearly identical performance’ between Gen 3 and Gen 4, confirming Oura’s algorithmic consistency across hardware generations.
Can the Oura Ring detect illness?
The Oura Ring can flag physiological signals consistent with oncoming illness — particularly elevated body temperature deviation, elevated resting heart rate, depressed HRV, and disrupted sleep architecture — through its Symptom Radar feature. The UCSF TemPredict Study demonstrated illness detection an average of 2 days before subjective symptoms. The ring cannot diagnose any specific illness and is not a medical device.
Does the Oura Ring track blood pressure?
No. As of 2026, the Oura Ring does not measure blood pressure. It does measure pulse wave velocity indirectly (via PPG waveform analysis) to estimate Cardiovascular Age — a proxy for arterial health — but this is not a blood pressure reading. Direct cuffless blood pressure estimation is a rumoured feature for future generations. For detailed context: Does the Oura Ring Measure Blood Pressure?.
What is the Oura Ring Readiness Score?
The Readiness Score (0–100) is Oura’s daily measure of how recovered and prepared your body is for the day. It integrates seven contributors: previous night’s sleep, sleep balance (cumulative sleep debt), activity balance, resting heart rate deviation from baseline, HRV balance (multi-day trend), body temperature deviation, and recovery index (overnight HR recovery rate). A score of 85+ indicates optimal readiness; below 70 indicates insufficient recovery.
Can the Oura Ring track menstrual cycles?
Yes. The Oura Ring’s Cycle Insights feature uses continuous nightly temperature measurements to detect the post-ovulation temperature rise, predict cycle phases, estimate the fertile window, and predict menstruation timing. The data also integrates with FDA-cleared Natural Cycles for a clinically validated birth control application. For women trying to conceive, the Fertile Window feature provides daily probability estimates based on your physiological data.
How does Oura Ring track stress?
Oura’s Daytime Stress feature uses continuous HRV, heart rate, and temperature data to assess your nervous system’s stress load throughout the day — displayed as a chart showing high-stress and recovery periods. The Resilience feature evaluates your ability to recover from stress loads over weeks. Oura cannot read psychological or emotional stress directly — it measures physiological stress responses that correlate with mental stress states.
What third-party apps does the Oura Ring work with?
The Oura Ring integrates with 40+ apps including Apple Health, Google Health Connect, Strava, TrainingPeaks, Natural Cycles, Flo, Clue, Calm, Headspace, Eight Sleep, Dexcom Stelo (glucose), and MyFitnessPal. The Oura API also enables custom integrations for developers.
Explore More Oura Ring Guides
| 🔗 Complete Oura Ring Resource Hub — myringsizecalculator.comOura Ring: Complete Guide (Main Hub) Generation & Technology →Oura Ring Generations: Gen 1 through Gen 5 Guide →Oura Ring Gen 4 Review: Is It Worth Buying? →How Does the Oura Ring 4 Work? Sensors Explained →Oura Ring 4 Battery Life: How Long Does It Last? Feature Deep-Dives →Can the Oura Ring Detect Sleep Apnea? →Does the Oura Ring Measure Blood Pressure? →Benefits of Oura Ring 4: What It Does for Your Health →Common Oura Ring 4 Problems & How to Fix Them Comparisons & Buying →Oura Ring Gen 4 vs Gen 3 vs Samsung Galaxy Ring →Best Oura Rings to Buy in 2026 →Is the Oura Ring Rose Gold Real? Ring Sizing →Free Ring Size Calculator — find your Oura Ring size before ordering |
Sources & External References
Clinical & Peer-Reviewed Research
- Sleep Medicine (Jan 2024) — Oura Ring Gen3 vs PSG Validation: 96 Participants, 421,045 Epochs
- OTO Open / PMC (2025) — Systematic Review & Meta-Analysis: Oura Ring vs Medical-Grade Sleep Studies
- Physiological Reports / PMC (2025) — HRV & RHR Validation: Oura vs ECG (536 nights, 5 devices)
- Scientific Reports / Nature (2025) — Ring Trackers for Diagnostic Sleep in Clinical Settings
- Sensors (2024) — Brigham & Women’s Hospital: Oura Ring Most Accurate Consumer Sleep Tracker
- UCSF TemPredict Study — Illness Detection via Wearable Temperature Data
- JAMA Network Open — Low VO₂ Max as Mortality Risk Factor (Mayo Clinic / Cleveland Clinic Study)
Official Sources
- Oura Ring Technology Overview — ouraring.com
- Oura Science & Research Portal
- Oura Smart Sensing Platform — Official Explanation
- Oura Cardiovascular Age & Cardio Capacity Launch
- Natural Cycles — FDA-Cleared Digital Contraceptive (Oura Integration Partner)
- Dexcom Stelo — OTC Continuous Glucose Monitor (Oura Integration Partner)
Wikipedia & High-Authority References
- Photoplethysmography — Wikipedia
- Heart Rate Variability — Wikipedia
- Resting Heart Rate — American Heart Association
- Sleep Apnea — NIH National Heart, Lung, and Blood Institute
- 10,000 Steps — Scientific Background (Wikipedia)
Last updated: March 2026 · Author: MyRingSizeCalculator.com Editorial Team
Medical Disclaimer: The Oura Ring is not a medical device and cannot diagnose, treat, or prevent any medical condition. All health information provided is for educational purposes only. Consult a qualified healthcare professional for any health concerns.